Brain SPECT Imaging in Neuropsychiatric Diagnosis and Monitoring
Theodore A. Henderson, MD, PhD
Mention SPECT (single photon emission computed tomography) brain imaging to a group of psychiatrists and you are likely to hear groans or angry retorts. The resistance to actually looking at brain function in psychiatric patients is startling. The well water seems to have been poisoned in psychiatry, perhaps by over-zealous marketing in the past. Early claims which were unsupported by clinical research data created a sense of distrust among psychiatrists. Oddly, nuclear medicine physicians have followed suit. Brain SPECT scanning has been underutilized and, frankly, underappreciated for decades. Nevertheless, during that same timespan, remarkable progress has been made in the hardware, software and clinical research revolving around brain SPECT scans. Herein, some of the more interesting advances will be explored and integrated into the practice of today’s busy nuclear medicine department.
Traumatic Brain Injury
Traumatic brain injury (TBI) is a complex disorder, as it varies depending on the part of the brain involved, the extent of injury, the post-injury protocols/progress, and immune/inflammation interactions1. While there are over 2.5 million emergency room visits for suspected TBI in the United States annually2, it is suspected that an additional 4 million mild TBI’s occur each year. Studies of civilians with TBI reveal that 49% develop a new psychiatric illness in the year subsequent to injury3,4. Victims of head injury in motor vehicle accidents also have a higher rate of post-traumatic stress disorder (PTSD) compared to those with orthopedic injuries 44% vs 11%)5. This overlap of TBI and PTSD can be particularly daunting among military troops and veterans. In the United States, roughly 20 veterans committed suicide each day in 2014, 2015, and 20166. PTSD and TBI have a significant contribution to the sense of despair and futility that lead veterans to take their own lives7. A sense of hopelessness for those veterans with TBI may stem from the common medical assertion that there is no treatment for TBI. In addition, veterans with PTSD or depression are often reluctant to seek help because they feel PTSD and depression are not real brain disorders, but a failure of character. Shame, guilt, fear of medications, and a lack of confidence in the therapies offered are also factors that keep veterans isolated, alone, and untreated.8-10 Current estimates indicate that 13.5% of returning military report persistent PTSD symptoms.11 According to the Congressional Budget Office, an estimated 400,000 service men and women have TBI or PTSD.12 Alas, among the 400,000 or more Veterans with either TBI or PTSD, there is tremendous overlap both in terms of diagnosis and of symptomatology. The overlap is estimated to be 33% to 42%,13 but may be considerably higher. A study of patients in the VA system revealed 73% of patients who reported TBI were also co-morbid for PTSD.14 Whether this is actual diagnostic overlap or the result of poor instruments for differentiating the two entities remains a critical question for the Department of Veterans Affairs (VA). It is likely that both alternatives contribute to this situation. For example, several of the questions in the Clinician-Administered PTSD scale15 identify symptoms that also could be a result of TBI, such as sleep difficulties, irritability, poor concentration, memory difficulties, anhedonia, and social isolation. As an indirect consequence of this conundrum, patients in the VA system are often diagnosed with only one or the other, and the comorbidity is ignored.12 Indeed, the VA admitted in November 2017 that it had misdiagnosed tens of thousands of veterans16.
Parsing out who has PTSD, who has TBI, and who has both is a critical issue for veterans. In the September 2015 issue of Brain Imaging and Behavior, a landmark paper on this question was published by a multi-center international team of clinician-scientists, including myself.17 This group examined the neuroimaging data of 196 military and Veteran patients who had undergone SPECT imaging, which is a functional neuroimaging modality based on the intimate relation between neuronal activity and local oxygenated blood perfusion (the same principle upon which functional magnetic resonance imaging or fMRI is based). When the areas of the brain involved in the default mode network were examined, a striking difference emerged. TBI could be distinguished from PTSD using SPECT with 94% accuracy (sensitivity = 92%, specificity = 85%). In addition, the ability to distinguish PTSD from co-morbid TBI+PTSD was 92% (sensitivity = 87%, specificity = 83%).17
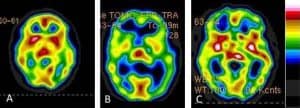
Figure 1. Cross sectional images from brain SPECT scans showing PTSD (A), TBI (B), and the combination of PTSD and TBI (C). Each has a very distinct appearance visually and when the default-mode network is analyzed, these conditions can be differentiated with 94% accuracy.6
Identifying TBI or PTSD in an individual patient is of little help if there are no effective treatments available for TBI. This is where some of our revolutionary work is opening up new opportunity to potentially repair brain injury. A large body of research work in the healing properties of near infrared (NIR) light has been amassed over the past 30 years18. NIR laser therapy utilizes penetrating photonic energy in the infrared spectrum to induce physiological and biochemical changes within targeted tissues. Early work established that NIR delivered with a laser could speed wound healing19,20, induce stem cell proliferation21, and stimulate tissue repair in deep tissues, such as cardiac muscle22. NIR light of wavelengths between 600-1,200 nm23 potently activate cytochrome c oxidase in the mitochondrial respiratory chain, which leads to increased adenosine triphosphate (ATP) production.23,24 Furthermore, tissue culture and animal studies implicate secondary molecular and cellular events that appear to be activated NIR light in these wavelengths impinges on mitochondria. Furthermore, NIR light also has been shown to activate transcription in both the mitochondria24 and the cell nucleus, with an increased transcription of over 100 genes24,25, including cell survival genes and key neural differentiation factors25. NIR light also increases the production of numerous growth factors and upregulates several inflammatory mediators in animal models26-28. Key growth factors stimulated by NIR light include nerve growth factor29, vascular endothelial growth factor30, brain-derived neurotrophic factor (BDNF)31,32, and transforming growth factor-beta33, which may contribute to late brain remodeling after TBI18,24,26. For example, a fourfold increase in BDNF protein expression occurs in a mouse TBI model after 3 treatments with 810 nm NIR light32.
By using multi-watt near-infrared laser therapy (NILT), we have shown the potential of coherent focused pulsed infrared light to provide superior penetration and focus in a controlled and safe manner to treat the living human brain. Patients have seen significant improvement of their symptoms, including: headaches, sleep disturbances, anxiety, mood regulation, impulsivity, depression, and resulting relationship problems and joblessness. The patients continue to do well after the treatment ends, even two to five years after receiving the treatment.
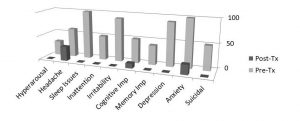
Figure 2: Summary of data from 10 patients treated with multi-watt NILT. Data showing changes in symptoms common to mild or moderate TBI. Many symptoms completely resolved. Headache persisted in 30% of patients, anxiety persisted in 20% and cognitive impairment persisted in 10% of patients.26
Our work with infrared light therapy shows it has benefit in PTSD and depression, as well. Our preliminary data on PTSD-related symptoms in our patients with TBI show a robust response.26 We recently published our data on the impact of multi-Watt infrared laser on depression.34
Dementia
Dementia actually encompasses several different diseases, including the well-known Alzheimer’s disease (AZD), frontotemporal dementia (FTD), Lewy Body dementia, vascular dementia and the precursor condition – Mild Cognitive Impairment (MCI). Perhaps the earliest study of dementia, published by Bonte and colleagues in 1986, documented decreased temporal lobe perfusion in 37 patients with AZD using 133Xe perfusion SPECT35. The early SPECT perfusion studies of AZD relied on a single-headed or low-resolution gamma cameras36,37. Later studies utilized higher resolution gamma cameras; however, some groups still used inferior single-headed cameras which resulted in compromised data38. Processing and interpretation, like the equipment, have undergone remarkable progress resulting in significantly improved diagnostic accuracy. Early studies depended on visual subjective interpretation or “eyeballing”. Inter-rater reliability was a significant factor39. Early attempts at semi-quantitative analysis remained subjective and compromised40-42. Notably, a weighted meta-analysis which excluded 123I-IMP and 99mT-ECD studies, derived a pooled weighted sensitivity and specificity of 48 99mT-HMPAO studies published prior to 2003. According to this meta-analysis, perfusion SPECT has a sensitivity of 74% and a specificity of 81% for the differentiation of AZD from elderly controls41. Studies encompassing the data published after 2003 showed considerably better accuracy43-46. Indeed, the combination of SPECT findings of temporal-parietal hypoperfusion and a clinical diagnostic profile consistent with AZD has a 96% sensitivity and an 84% specificity with even low-resolution single-headed SPECT cameras47. Taken together, studies of perfusion SPECT in the diagnosis of AZD with comparison to a longitudinal clinical course and/or histopathology demonstrates a sensitivity in the range of 82-96% and a specificity in the range of 84-89%46. This is comparable to the sensitivity of FDG-PET (88-94%) and superior to the specificity of FDG-PET (63-73%). See Figure 3 for an example of the typical appearance of FTD and AZD on perfusion SPECT.
The early pathophysiological changes which occur in AZD underscore the value of perfusion changes in the posterior cingulate as an early signal. The posterior cingulate gyrus receives input from the subiculum and projects to the anterior thalamus48. Several studies have demonstrated functional correlation between the posterior cingulate and the entorhinal cortex49,50. The entorhinal cortex appears to be one of the first sites to accumulate neurofibrillary tangles and neuritic plaques preceding even the hippocampus51. Indeed, portions of the entorhinal cortex may undergo 40-60% neuronal loss prior to measurable memory loss52. So, patients with only mild subjective memory impairment may already have significant AZD-specific pathology present in the entorhinal cortex. As a result, hypoperfusion in the posterior cingulate gyrus as revealed by a SPECT scan is a valuable early warning sign for AZD35,46. Indeed, SPECT perfusion scans are superior to FDG-PET scans in this area because the posterior cingulate gyrus has a higher baseline level of neuronal activity compared to the surrounding cortex46. Thus, FDG-PET may under-estimate the decrement in function in the key diagnostic area of the brain.
Recently, several groups have focused on novel methods of image analysis to enhance the identification of prodromal AZD among patients with MCI. Habert and colleagues53 utilized statistical analysis in a sample of 83 patients with memory complaints who were followed over three years. They found similar sensitivity and specificity as described above. Pagani and colleagues54 used principal component analysis to differentiate mild and moderate AD. Again, the hippocampus, parietal cortex, and posterior cingulate emerged as discriminative features for the severity of AZD. Chaves and colleagues55 found linear kernel support vector analysis significantly increased the diagnostic power of SPECT in identifying early mild AZD. In a sample of 38 patients with mild AZD, the approach yielded a sensitivity of 97%, a specificity of 100% and an accuracy of 99%.
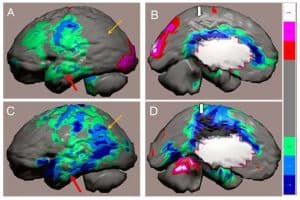
Figure 3: Figure 1. Tc-99m-HMPAO perfusion SPECT scan data from a patient with a diagnosis of fronto-temporal dementia (A,B) compared to the SPECT scan data of a patient with the diagnosis of Alzheimer’s disease (C,D). The patients’ data compared to a normative database (N= 68) and a map of statistically significant differences generated using the Oasis software by Segami Inc. Here, the color scale indicates gray for areas that do not differ significantly from the normative
database. In contrast, areas of green, light blue and dark blue represent areas of more than 2, 3, and 4 SD below the mean perfusion of the normative database, respectively. Statistically significant increases in perfusion are illustrated in the red color scale. Decreased perfusion in the temporal lobes (red arrow), parietal cortex (orange arrow) and posterior cingulate gyrus (thick white arrow) are hallmark findings in Alzheimer’s disease, but in frontotemporal dementia the posterior cingulate (thick white arrow) is preserved, but perfusion in decreased in the frontal and temporal lobes.
In summary, SPECT is a valuable tool in the identification of AZD, the differentiation of other dementias, and the detection of MCI. In several studies, SPECT detected MCI functional patterns prior to the onset of significant neuropsychological impairment. SPECT out-performs clinical assessment alone which is generally 49-63% sensitive and 89-94% specific56. Even when using older, single-headed SPECT cameras and visual inspection, several studies have found SPECT can differentiate AZD with a sensitivity ranging from 82-96% and a specificity ranging from 84-89%46. This exceeds the standard set forth for minimal criteria for a biological marker of AZD as defined by the Ronald and Nancy Reagan Research Institute of the Alzheimer’s Association and the National Institute on Aging Working Group57. Using sophisticated statistical analysis, perfusion SPECT scans can yield a sensitivity of 97%, a specificity of 100% and an accuracy of 99%55. SPECT, alone or in combination with genetic testing, has the potential to provide prognostic information and differentiate those at risk for progression of MCI to AZD46.
Currently, there are three amyloid PET tracers available. Each is priced at over $3,000 per scan. Regardless of the amyloid tracer, in healthy controls, the tracer uptake is limited to the white matter. The rim of uninvolved cortex can be clearly discerned in a normal amyloid scan. This is true until about age 50 years46. At this point, roughly 10% of controls will show cortical uptake. Persons in their 60’s will show cortical uptake in 12% of cases46. This false positive rate increases to 30% for patients in their 70’s and 50% in patients in their 80’s46. So while amyloid scans have a certain sex-appeal and have been heavily promoted by the manufacturers, they have declining specificity with age. This, combined with the cost and the fact that many insurance companies and US Medicare will not reimburse for the procedure, lessens the appeal of amyloid scans. In contrast, SPECT scans for dementia workup are reimbursed by Medicare and many insurance companies.
Over the next 15 years, the number of patients with AZD will almost triple worldwide. The population affected by MCI will grow to at least 123 million46. As disease mitigating pharmaceuticals become available, early identification of patients with MCI who are likely to benefit will emerge as a critical need. Interrupting the swelling ranks of those affected by AZD will require early diagnosis of MCI and differentiation of those likely to progress and those who are stable. Research presented above demonstrates that SPECT with statistical parametric analysis can distinguish subtypes of MCI with reasonable accuracy. While the goal for the diagnosis of AZD has been 100% accuracy, this reflects the concern of giving an incorrect diagnosis. As our ability to pharmacologically alter the course of these disease processes improves, the burden is shifted to providing an early preliminary diagnosis so that treatment can be initiated early while mitigation of the disease process is still possible. Newer high resolution, low radiation dose, SPECT cameras are on the horizon, which will further lower the risk of early diagnosis by SPECT. SPECT can provide an economical strategy for early identification and monitoring.
Psychiatric Co-Morbidity
Psychiatry and Neurology are fields of medicine rooted in the brain. While Freudian musings about the impact of childhood experiences on the development of Id and Ego can be entertaining, ultimately the mechanism by which these childhood experiences influence the adult are by changes in the functional neurocircuitry and neurophysiology. The interplay of genes and experience take place on the canvas of neurocircuitry. Neuroimaging has found an uneasy alliance with Neurology. However, Psychiatry has rebuked neuroimaging. While there was initial excitement in Psychiatry about CT imaging and it was employed at multiple centers to search for structural abnormalities in a variety of psychiatric conditions58. When MRI became widely available, with its greater resolution and improved white matter/grey matter distinction, a renewed effort to find anatomical correlates for psychiatric conditions was launched59,60. These efforts proved relatively fruitless. Since anatomy tells us little about brain function, CT and MRI fell to the wayside in Psychiatry.
First, it is important to make a distinction between the idea that neuroimaging can reveal what is going on in the brains of patients with various disorders and the idea of neuroimaging providing us with a “fingerprint” or pathognomonic sign of a Diagnostic and Statistical Manual of Mental Disorders (DSM) diagnosis. Let me remind you that DSM diagnoses were developed as a tool to categorize patients by their signs and symptoms – their subjective experiences and some objective signs of their behavior. The DSM was not designed with the brain in mind. There is little or no reason to assume that the functional aspects of the brain will neatly fit into DSM categories. Secondly, there is an assumption in Psychiatry that patients have only one diagnosis – a misapplication of Occam’s (Ockham’s) razor. Indeed, according to DSM criteria, if a person has ADHD and another DSM diagnosis, they technically cannot have ADHD. Yet, clinically we know that comorbidity is the rule rather than the exception in ADHD. Similarly, patients with depression often have comorbid anxiety. More than likely, we will find that patients will have multiple processes co-occurring. Third, there is an expectation of neuroimaging to perfectly “make the diagnosis”, which is perhaps at the heart of the somewhat irrational attacks made by psychiatry upon neuroimaging, often from a position of ignorance. It does not seem that Psychiatry exercises similar scrutiny in examining the diagnostic accuracy of thyroid tests, Conners’ Continuous Performance Tests, Minnesota Multiphasic Personality Inventory (MMPI), Rorschach’s, chest X-rays, cholesterol tests, or a host of other modalities with use in the practice of medicine. For example, we routinely use chest X-rays to diagnose various disorders. There is an assumption that chest X-rays give us the diagnosis. Let’s take the example of a large solitary pulmonary mass of size greater than 4 cm. According to Reeder and Felson’s definitive text Gamuts in Radiology (1975)61, this could be an abscess, bronchogenic carcinoma, alveolar cell carcinoma, metastasis, arteriovenous malformation, bronchial adenoma, fluid filled cyst, hamartoma, hematoma, inflammatory pseudotumor, organized nodular pneumonia, lipoid pneumonia, loculated pleural fluid, lymphoma, pneumoconiosis, pulmonary sequestration, sarcoma, or Wegener’s granuloma. How does one distinguish among this myriad of diagnostic possibilities? It is done by clinical correlation and additional testing. The diagnosis is made ultimately by the physician as a result of synthesizing the imaging data, the testing data, and the clinical information. PSYCHIATRY IS, AND SHOULD BE, NO DIFFERENT. Our diagnoses should be made based on the synthesis of data – laboratory data, neuroimaging data, and clinical data. But ultimately, the physician makes the diagnosis, not the lab test. Outside of bacterial cultures, there are very few tests with 100% sensitivity or specificity.
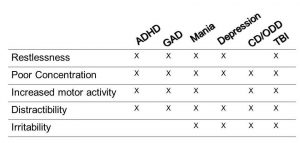
Let’s take the example of ADHD. Many believe you can diagnose ADHD from the door or down the aisle of a grocery store wherein a child is running about uncontrolled. However, let’s example the specific diagnostic criteria for ADHD – restlessness, hyperactivity, poor concentration, distractibility, and inattention. As shown in the chart below, these supposedly diagnostic criteria overlap with numerous diagnoses, including generalized anxiety disorder (GAD), mania, irritable depression, conduct disorder/oppositional defiant disorder (CD/ODD), and traumatic brain injury (TBI). With functional neuroimaging, certain neurophysiological processes become evident which guide the diagnosis. In a neurotypical person, frontal lobe activity increases during concentration. In persons with ADHD, frontal lobe activity actually decreases when they concentrate. It is hard to focus because the frontal lobes – specifically the orbitofrontal cortices – go “offline” when they attempt to concentrate due to a deficiency in frontal lobe dopamine62. I have seen many cases of adolescents with “Bipolar disorder” who are not responding to mood stabilizers, like lithium or valproate, who show frontal lobe decrease with concentration. Not surprisingly, they do quite well on a stimulant medication. Cherkosova and Hechtman63 reviewed the neuroimaging findings in ADHD in the Canadian Journal of Psychiatry in 2009. The frontal lobes and the connection between the striatum and frontal lobes figure prominently in the research literature. Surprisingly, the cerebellum has an important role in ADHD affecting error frequency and response to stimuli. There are possibly multiple “forms” of ADHD, as some patients show abnormal temporal lobe or abnormal parietal lobe function. Recently, Schneider and a group of Canadian clinicians64 examined the contribution of orbitofrontal cortical hypoperfusion in the diagnosis of ADHD. They found that reading only conventional tomogram or “slice” data resulted in low sensitivity (4%) and low positive predictive value (44%). In contrast, using 3-dimensional renderings of the SPECT data increased sensitivity and positive predictive value (84% if the concentration scan was used).
SPECT functional neuroimaging also guides the clinician away from an erroneous diagnosis of ADHD. For example, when there is no sign of orbitofrontal hypoperfusion during a concentration task and the entire cortex is quite overactive, one can feel secure in diagnosing mood dysregulation and treating with a mood stabilizer. I have also observed numerous cases of learning disorders in which the only area of abnormal function with markedly decreased temporal lobe function. For example, one young adolescent girl who was quite bright and articulate, but had math comprehension at the 35th percentile and reading comprehension at the 10th percentile. Her Connors Continuous Performance Test was negative for ADHD. She had very low temporal lobe function. As I have done for many such cases, I started her on donepezil, a medication used in treating Alzheimer’s disease which increases acetylcholine levels. Since acetylcholine is the neurotransmitter of learning and memory and a key neurotransmitter of the temporal lobes, it is not surprising that within three months, her math skills had jumped 2 years and her reading comprehension had jumped 1.5 years.
SPECT functional neuroimaging can show other causes of cognitive dysfunction. I have now seen several cases of Chronic Fatigue Syndrome which presented as predominately academic struggles. The SPECT scan did not show frontal lobe hypoperfusion; rather, it showed diffuse hypoperfusion involving the entire brain. Additional laboratory testing confirmed the presence of viral causes of Chronic Fatigue Syndrome and the patients’ academic struggles improved after treatment with antiviral therapy65. TBI also is often confused with ADHD, depression, anxiety, and other psychiatric diagnoses. TBI, due to damage to different functional areas in the brain, can present with a myriad of symptoms, including poor concentration and focus. Stimulants can be helpful in TBI because they increase frontal lobe dopamine, but they are a bandaid, not a treatment. As described above, treating the TBI with NILT has resulted in substantial improvement in concentration and cognitive performance for many patients.
Conclusion
Perfusion SPECT functional neuroimaging can teach us much about a patient’s brain. The challenge that psychiatrists face is to correctly understand the strengths and weaknesses of the diagnostic constructs and how data on brain function fits together with clinical information. The false expectation of precise or pathognomonic symptoms or signs leads to unrealistic expectations from functional neuroimaging – be it SPECT, functional MRI, or FDG PET. I have offered numerous examples of situations in which the symptoms do not match the diagnosis – depressive symptoms in TBI, dementia symptoms can be either AZD or FTD, and ADHD symptoms in a variety of conditions. Information from functional neuroimaging can yield a better diagnosis and speed the diagnostic process64. Perhaps with these thoughts both psychiatrists and nuclear medicine physicians will reconsider their biases against perfusion SPECT neuroimaging. Decades of research with functional MRI have failed to yield any useful clinical algorithms. In contrast, SPECT has demonstrated sensitivity/specificity in the 85-95% range for TBI, PTSD, AZD, FTD, MCI, and offers relevant insight into alternative neurological processes responsible for symptoms such as depressed mood, impulsivity, executive dysfunction, and others.
References
-
Barkhoudarian G, Hovda DA, Giza CC (2011) The molecular pathophysiology of concussive brain injury. Clin Sports Med 30: 33-48, vii-iii.
-
Center for Disease Control and Prevention. Injury Prevention and Control: Traumatic Brain Injury. Available: http://www.cdc.gov/TraumaticBrainInjury. Accessed 3 November 2017.
-
Fann JR, Burington B, Leonetti A, Jaffe K, Katon WJ, et al. (2004) Psychiatric illness following traumatic brain injury in an adult health maintenance organization population. Arch Gen Psychiatry 61: 53-61.
-
Jorge RE, Robinson RG, Moser D, Tateno A, Crespo-Facorro B, et al. (2004) Major depression following traumatic brain injury. Arch Gen Psychiatry 61: 42-50.
-
Bombardier CH, Fann JR, Temkin NR, Esselman PC, Barber J, et al. (2010) Rates of major depressive disorder and clinical outcomes following traumatic brain injury. JAMA 303: 1938-1945.
-
USA Today website. http://www.usatoday.com/story/news/nation/2016/07/07/veterans-suicides-young-men-women/86755132/. Accessed July 7, 2016.
-
Henderson, TA. Veteran suicides fuel widespread demands for answers. Psychiatry Advisor. http://www.psychiatryadvisor.com/suicide-and-self-harm/preventing-veteran-suicide/article/508582.
-
Stecker T, Shiner B, Watts BV, et al. Treatment-seeking barriers for veterans of the Iraq and Afghanistan conflicts who screen positive for PTSD. Psychiatric Services. 2013; 64(3):280-283. doi:10.1176/appi.ps.001372012
-
Bryan CJ, Morrow CE, Etienne N, Ray-Sannerud B. Guilt, shame, and suicidal ideation in a military outpatient clinical sample. Depression and Anxiety. 2013; 30(1):55-60. doi:10.1002/da.22002
-
Hoge CW, Grossman SH, Auchterlonie JL, et al. PTSD treatment for soldiers after combat deployment: low utilization of mental health care and reasons for dropout. Psychiatric Services. 2014; 65(8):997-1004. doi:10.1176/appi.ps.201300307
-
Dursa EK, Reinhard MJ, Barth SK, Schneiderman AI. Prevalence of a Positive Screen for PTSD Among OEF/OIF and OEF/OIF-Era Veterans in a Large Population-Based Cohort. Journal of Traumatic Stress. 2014; 27(5):542-549. doi:10.1002/jts.21956.
-
Congressional Budget Office. The Veterans Health Administration’s Treatment of PTSD and Traumatic Brain Injury Among Recent Combat Veterans. 2012. The Congress of the United States, Washington, D.C.
-
Lew HL. Rehabilitation needs of an increasing population of patients: Traumatic brain injury, polytrauma, and blast-related injuries. Journal of Rehabilitation Research and Development. 2005;42(4):xiii-xvi.
-
Taylor BC, Hagel EM, Carlson KF, et al. Prevalence and costs of co-occurring traumatic brain injury with and without psychiatric disturbance and pain among Afghanistan and Iraq War Veteran V.A. users. Medical Care. 2012;50(4):342-346. doi:10.1097/MLR.0b013e318245a558.
-
Blake DD, Weathers FW, Nagy LM, et al. National Center for Posttraumatic Stress Disorder. 1998. http://www.clintools.com/victims/resources/assessment/ptsd/protected/CAPSIV.pdf. (Accessed November 16, 2015).
-
Thousands of potentially misdiagnosed vets fail to get re-tested for TBI. http://www.cbs46.com/story/36965673/untested-vets-thousands-of-the-potentially-misdiagnosed-fail-to-get-re-tested-for-tbi. Accessed December 1, 2017.
-
Raji CA, Willeumier K, Taylor D, et al. Functional neuroimaging with default mode network regions distinguishes PTSD from TBI in a military veteran population. Brain Imaging Behav. 2015;9(3):527-34.
-
Salehpour F, Mahmoudi J, Kamari F, Sadigh-Eteghad S, Rasta SH, Hamblin MR. Brain Photobiomodulation Therapy: a Narrative Review. Mol Neurobiol. 2018 Jan 11. doi: 10.1007/s12035-017-0852-4.
-
Mester E, Mester AF, Mester A. The biomedical effects of laser application. Lasers Surg Med. 1985;5(1):31-9.
-
Enwemeka CS. Intricacies of dose in laser phototherapy for tissue repair and pain relief. Photomed Laser Surg. 2009;27(3):387-93.
-
Tuby H, Maltz L, Oron U. Induction of autologous mesenchymal stem cells in the bone marrow by low-level laser therapy has profound beneficial effects on the infarcted rat heart. Lasers Surg Med. 2011;43(5):401-9.
-
Yang Z, Wu Y, Zhang H, Jin P, Wang W, Hou J, et al. Low-level laser irradiation alters cardiac cytokine expression following acute myocardial infarction: a potential mechanism for laser therapy. Photomed Laser Surg. 2011;29(6):391-8.
-
Karu TI, Kolyakov SF. Exact action spectra for cellular responses relevant to phototherapy. Photomed Laser Surg. 2005;23(4):355-61.
-
Henderson TA, Morries LD. Near-Infrared Photonic Energy Penetration – Can infrared phototherapy effectively reach the human brain? Neuropsychiatr Dis Treat. 2015A Aug 21;11:2191-208.
-
Zhang Y, Song S, Fong CC, Tsang CH, Yang Z, Yang M. cDNA microarray analysis of gene expression profiles in human fibroblast cells irradiated with red light. J Invest Dermatol. 2003;120(5):849-57.
-
Morries LD, Cassano P, Henderson TA. Treatments for traumatic brain injury with emphasis on transcranial near-infrared laser phototherapy. Neuropsychiatr Dis Treat. 2015 Aug 20;11:2159-75.
-
Huang YY, Chen AC, Carroll JD, Hamblin MR. Biphasic dose response in low level light therapy. Dose Response. 2009;7(4):358-83.
-
Chung H, Dai T, Sharma SK, Huang YY, Carroll JD, Hamblin MR. The nuts and bolts of low-level laser (light) therapy. Ann Biomed Eng. 2012;40(2):516-33.
-
Schwartz F, Brodie C, Appel E, Kazimirsky G, Shainberg A. Effect of helium/neon laser irradiation on nerve growth factor synthesis and secretion in skeletal muscle cultures. J Photochem Photobiol B. 2002;66(3):195-200.
-
Szymanska J, Goralczyk K, Klawe JJ, Lukowicz M, Michalska M, Goralczyk B, et al. Phototherapy with low-level laser influences the proliferation of endothelial cells and vascular endothelial growth factor and transforming growth factor-beta secretion. J Physiol Pharmacol. 2013;64(3):387-91.
-
Meng C, He Z, Xing D. Low-level laser therapy rescues dendrite atrophy via upregulating BDNF expression: implications for Alzheimer’s disease. J Neurosci. 2013;33(33):13505-17.
-
Xuan W, Agrawal T, Huang L, Gupta GK, Hamblin MR. Low-level laser therapy for traumatic brain injury in mice increases brain derived neurotrophic factor (BDNF) and synaptogenesis. J Biophotonics. 2015 Jun;8(6):502-11.
-
Leung MC, Lo SC, Siu FK, So KF. Treatment of experimentally induced transient cerebral ischemia with low energy laser inhibits nitric oxide synthase activity and up-regulates the expression of transforming growth factor-beta 1. Lasers Surg Med. 2002;31(4):283-8.
-
Henderson, TA, Morries LD. Multi-Watt Infrared Phototherapy for the Treatment of Comorbid Depression: An Open Label Single-Arm Study. Frontiers in Psychiatry. 2017; 8:187. https://doi.org/10.3389/fpsyt.2017.00187.
-
Bonte FJ, Ross ED, Chehabi HH, et al. SPECT study of regional cerebral blood flow in Alzheimer disease. J Comput Assist Tomogr. 1986;10(4):579-83.
-
Battistin L, Pizzolato G, Dam M, et al. Regional cerebral blood flow study with 99mTc-hexamethyl-propyleneamine oxime single photon emission computed tomography in Alzheimer’s and multi-infarct dementia. Eur Neurol. 1990;30(5):296-301.
-
Knapp WH, Dannenberg C, Marschall B, et al. Changes in local cerebral blood flow by neuroactivation and vasoactivation in patients with impaired cognitive function. Eur J Nucl Med. 1996;23(8):878-88.
-
Varma AR, Adams W, Lloyd JJ, et al. Diagnostic patterns of regional atrophy on MRI and regional cerebral blood flow change on SPECT in young onset patients with Alzheimer’s disease, frontotemporal dementia and vascular dementia. Acta Neurol Scand. 2002;105(4):261-9.
-
Hellman RS, Tikofsky RS, Van Heertum R, et al. A multi-institutional study of interobserver agreement in the evaluation of dementia with rCBF/SPET technetium-99m exametazine (HMPAO). Eur J Nucl Med. 1994;21(4):306-13.
-
Talbot PR, Lloyd JJ, Snowden JS, et al. A clinical role for 99mTc-HMPAO SPECT in the investigation for dementia? J Neurol Neurosurg Psychiatry. 1998;64(3):306-13.
-
Dougall NJ, Bruggink S, Ebmeier KP. Systematic review of the diagnostic accuracy of 99mTc-HMPAO-SPECT in dementia. Am J Geriatr Psychiatry. 2004;12(6):554-70.
-
Van Heertum RL. Dementia: Diagnosis of Dementia. In: Van Heertum RL, Tikofsky RS, Ichise M, eds. Functional Cerebral SPECT and PET Imaging. 4th ed. Philadelphia, PA: Lippincott Williams & Wilkins; 2010:81-95.
-
Bonte FJ, Harris TS, Roney CA, et al. Differential diagnosis between Alzheimer’s disease and frontotemporal disease by the posterior cingulate sign. J Nucl Med. 2004;45(5):771-4.
-
Jobst KA, Barnetson LP, Shepstone BJ. Accurate prediction of histologically confirmed Alzheimer’s disease and the differential diagnosis of dementia: the use of NINCDS-ADRDA and DSM-III-R criteria, SPECT, X-ray CT, and Apo E4 in medial temporal lobe dementias. Oxford Project to Investigate Memory and Aging. Int Psychogeriatr. 1998;10(3):271-302.
-
Matsuda H. The role of neuroimaging in mild cognitive impairment. Neuropathology. 2007;27(6):570-7.
-
Henderson, TA. The diagnosis and evaluation of dementia and mild cognitive impairment with emphasis on SPECT perfusion neuroimaging. CNS Spectrums, Dec;17(4):176-206, 2012.
-
Bonte FJ, Weiner MF, Bigio EH, et al. Brain blood flow in the dementias: SPECT with histopathological correlation in 54 patients. Radiology 1997;202(3):793-797.
-
Desgranges B, Baron JC, de la Sayette V, et al. The neural substrates of memory systems impairment in Alzheimer’s disease. A PET study of resting brain glucose utilization. Brain. 1998;121(Pt 4):611-31.
-
Mosconi L, Pupi A, De Cristofaro MT, et al. Functional interactions of the entorhinal cortex: an 18F-FDG PET study on normal aging and Alzheimer’s disease. J Nucl Med. 2004;45(3):382-92.
-
Hirao K, Ohnishi T, Matsuda H, et al. Functional interactions between entorhinal cortex and posterior cingulate cortex at the very early stage of Alzheimer’s disease using brain perfusion single-photon emission computed tomography. Nucl Med Commun. 2006;27(2):151-6.
-
Gómez-Isla T, Price JL, McKeel DW Jr, et al. Profound loss of layer II entorhinal cortex neurons occurs in very mild Alzheimer’s disease. J Neurosci. 1996;16(14):4491-500.
-
Price JL, Ko AI, Wade MJ, et al. Neuron number in the entorhinal cortex and CA1 in preclinical Alzheimer disease. Arch Neurol. 2001;58(9):1395-402.
-
Habert MO, Horn JF, Sarazin M, et al. Brain perfusion SPECT with an automated quantitative tool can identify prodromal Alzheimer’s disease among patients with mild cognitive impairment. Neurobiol Aging. 2011;32(1):15-23.
-
Pagani M, Salmaso D, Rodriguez G, et al. Principal component analysis in mild and moderate Alzheimer’s disease–a novel approach to clinical diagnosis. Psychiatry Res. 2009;173(1):8-14.
-
Chaves R, Ramírez J, Górriz JM, et al. SVM-based computer-aided diagnosis of the Alzheimer’s disease using t-test NMSE feature selection with feature correlation weighting. Neurosci Lett. 2009;461(3):293-7.
-
Petersen RC, Stevens JC, Ganguli M, et al. Practice parameter: early detection of dementia: mild cognitive impairment (an evidence-based review). Report of the Quality Standards Subcommittee of the American Academy of Neurology. Neurology. 2001;56(9):1133-42.
-
Consensus report of the Working Group on: “Molecular and Biochemical Markers of Alzheimer’s Disease”. The Ronald and Nancy Reagan Research Institute of the Alzheimer’s Association and the National Institute on Aging Working Group. Neurobiol Aging. 1998;19(2):109-16.
-
Weinberger DR, Torrey EF, Neophytides AN, Wyatt RJ. Structural abnormalities in the cerebral cortex of chronic schizophrenic patients. Arch Gen Psychiatry. 1979 Aug;36(9):935-9.
-
Andreasen N, Nasrallah HA, Dunn V, Olson SC, Grove WM, Ehrhardt JC, Coffman JA, Crossett JH. Structural abnormalities in the frontal system in schizophrenia. A magnetic resonance imaging study. Arch Gen Psychiatry. 1986 Feb;43(2):136-44.
-
DeMyer MK, Gilmor RL, Hendrie HC, DeMyer WE, Augustyn GT, Jackson RK. Magnetic resonance brain images in schizophrenic and normal subjects: influence of diagnosis and education. Schizophr Bull. 1988;14(1):21-37.
-
Reeder, MM, Felson B. Gamuts in Radiology. Audiovisual Radiology of Cincinnati, Inc. 1975. Cincinnati.
-
Lee JS, Kim BN, Kang E, Lee DS, Kim YK, Chung JK, Lee MC, Cho SC. Regional cerebral blood flow in children with attention deficit hyperactivity disorder: comparison before and after methylphenidate treatment. Hum Brain Mapp. 2005, 24(3):157-64.
-
Cherkasova MV, Hechtman L, Neuroimaging in Attention-Deficit Hyperactivity Disorder: Beyond the Frontostriatal Circuitry. Can. J. Psychiatry 2009, 54, 651–664.
-
Schneider H, Thornton JF, Freeman MA, McLean MK, van Lierop MJ, Schneider J. Conventional SPECT Versus 3D Thresholded SPECT Imaging in the Diagnosis of ADHD: A Retrospective Study. J. Neuropsychiatry Clin Neurosci. 2014, 26(4):335-43.
-
Henderson TA. The role of antiviral therapy in chronic fatigue treatment. http://www.psychiatryadvisor.com/opinion/the-role-of-antiviral-therapy-in-chronic-fatigue-treatment/article/405424/