A clinical case showing the great usefulness of myocardial perfusion imaging
Daniel P. Levin, MD, FRCPC
Section Head, Nuclear Medicine, Grace Hospital, Winnipeg, Manitoba
Nuclear Medicine Physician, Health Sciences Centre, Winnipeg, Manitoba
Board member, CANM
Some people go to see their doctor with problems that are clear-cut. A sore throat and a stuffy nose usually mean the person has a cold. For other patients, the diagnosis is not as easy.
People can have many different kinds of pain in their chest. Some of these pains can be caused by coronary artery disease, a blockage of the blood vessels supplying the heart muscle. If an elderly man has squeezing or pressing chest pain in the centre or left side of the chest which comes on with exercise and goes away with rest, the pain is almost certainly caused by coronary artery disease. The diagnosis can be made with an exercise stress test, and this may lead to an angiogram, an x-ray that looks directly at the coronary arteries. If there are obvious areas of blockage, they can be repaired during the angiogram or with bypass surgery.
Other times, it is not so clear. I will describe a patient in whom the diagnosis was not clear at all, and how Nuclear Medicine imaging allowed him to get the treatment he needed.
This 54-year old man was experiencing right chest pain which was sometimes sharp and sometimes dull, lasted for a long time, sometimes came on at rest and occasionally with exercise, and did not always go away when the patient rested. This is not the typical pain caused by coronary artery disease. He also couldn’t walk as far as he used to. The first group of tests were all negative, and an exercise stress test was also negative, although he couldn’t exercise for very long. He was sent to Nuclear Medicine for Myocardial Perfusion Imaging (MPI).
In a case like this, when the patient can’t exercise enough to raise their heart rate, a Myocardial Perfusion Imaging study (MPI) can be performed with Dipyridamole. This test involves injection of a radiopharmaceutical, a radioactive material or agent, which goes to the heart muscle. There are two injections of the agent: one is done with the patient in a resting state, and the other is done after the patient is given Dipyridamole, a medication which affects blood flow to the heart. Images of the heart are taken after each injection and the Dipyridamole (stress) images are compared to the rest images. Decreased uptake of the agent in an area of the heart muscle means poor blood flow to that area, and can indicate a blocked artery.
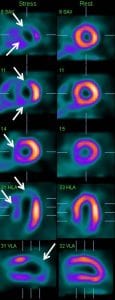
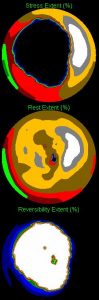
Our patient had a Dipyridamole MPI study which was very abnormal. Figure 1 shows what is called an extensive reversible defect. The defect at stress (left column) is outlined by the white arrows and is shown in purple or blue. The orange or white areas are normal. On the rest images, uptake in the area of the defect is improved. This represents a large area of heart muscle at risk for a heart attack, which is shown graphically in Figure 2.
As soon as the result was available, an angiogram was arranged to see how many arteries were blocked and what could be done. The angiogram showed severe narrowing of all three of the major arteries supplying the heart, and the patient had a bypass operation to improve the blood flow to his heart.
This patient’s symptoms were so unusual that his doctors weren’t sure that the problem was caused by his heart. But Nuclear Medicine Myocardial Perfusion Imaging was able to give the correct diagnosis, and the patient had the surgery he needed.
Legend:
Figure 1: Imaging slices through the heart after Dipyridamole stress (left column) show decreased uptake of the agent in the left side of the heart and the apex, the end of the heart (white arrows). At rest, these areas are much brighter, showing improved uptake.
This means that when the heart works harder, there is not enough blood flow to someareas.
Figure 2: These maps represent the uptake of the agent by the heart. The large black area on the top map shows how much of the heart has abnormal flow after Dipyridamole. The middle map shows that at rest, blood flow is normal. The bottom map shows the difference of these two, and the white area tells us how much of the heart is at risk.